Tensorboard 实例

Tensorboard 实例

构建数据流图

1
2
3
4
5
6
7
8
9
10
11
12
13
14
15
16
17
18
19
20
21
22
23
24
25
26
27
28
29
30
31
32
33
34
35
36
37
38
39
40
41
42
43
44
45
46
import tensorflow as tf
graph = tf.Graph()
with graph.as_default():
with tf.name_scope("variables"):
# 记录数据流图运行次数的 Variable 对象
global_step = tf.Variable(0, dtype=tf.int32, trainable=False, name="global_step")
# 追踪该模型的所有输出随时间的累加和的 Variable 对象
total_output = tf.Variable(0.0, dtype=tf.float32, trainable=False, name="total_output")
with tf.name_scope("transformation"):
# 独立的输入层
with tf.name_scope("input"):
# 创建输出占用符, 用于接收一个向量
a = tf.placeholder(tf.float32, shape=[None], name="input_placeholder_a")
# 独立的中间层
with tf.name_scope("intermediate_layer"):
b = tf.reduce_prod(a, name="product_b")
c = tf.reduce_sum(a, name="sum_c")
# 独立的输出层
with tf.name_scope("output"):
output = tf.add(b, c, name="output")
with tf.name_scope("update"):
# 用最新的输出更新 Variable 对象 total_output
update_total = total_output.assign_add(output)
# 将前面的 Variable 对象 global_step 曾1,只要数据流图运行,该操作需要进行
increment_step = global_step.assign_add(1)
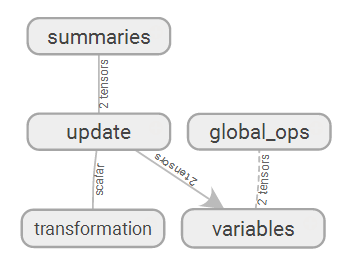
with tf.name_scope("summaries"):
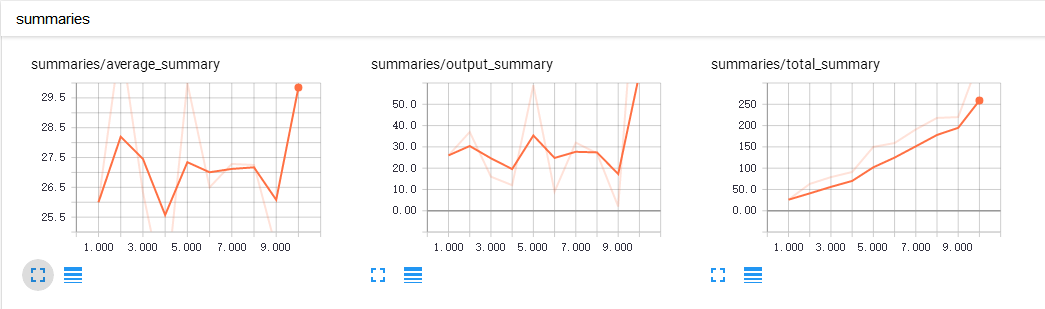
avg = tf.div(update_total, tf.cast(increment_step, tf.float32), name="average")
# 为输出节点创建汇总数据
tf.summary.scalar('output_summary', output)
tf.summary.scalar('total_summary', update_total)
tf.summary.scalar('average_summary', avg)
with tf.name_scope("global_ops"):
# 初始化Op
init = tf.initialize_all_variables()
# 将所有汇总数据合并到一个Op中
merged_summaries = tf.summary.merge_all()

运行数据流图

1
2
3
4
5
6
7
8
9
10
11
12
13
14
15
16
17
18
19
20
21
22
23
24
25
26
27
28
29
30
31
32
33
34
35
36
# 用明确定义的 Graph 对象启动一个会话
sess = tf.Session(graph=graph)
# 开启一个 summary.FileWriter 对象, 保存汇总数据
writer = tf.summary.FileWriter('./improved_graph', graph)
# 初始化 Variable 对象
sess.run(init)
# 为方便代码复用,定义辅助函数 run_graph()
# 用以输入张量以运行数据流图,并保存汇总数据
def run_graph(input_tensor):
feed_dict = {a: input_tensor}
_, step, summary = sess.run([output, increment_step, merged_summaries], feed_dict=feed_dict)
writer.add_summary(summary, global_step=step)
# 用不同的输入运行该数据流图
run_graph([2, 8])
run_graph([3, 1, 3, 3])
run_graph([8])
run_graph([1, 2, 3])
run_graph([11, 4])
run_graph([4, 1])
run_graph([7, 3, 1])
run_graph([6, 3])
run_graph([0, 2])
run_graph([4, 5, 6])
# 将汇总数据写入磁盘
writer.flush()
# 关闭 summary.FileWriter 对象
writer.close()
# 关闭 Session 对象
sess.close()

TensorBoard Graph 效果:

scalar 将显示汇总 summaries:

Recommended Posts